Background
I have a detailed spreadsheet for tracking our investments and financial metrics. It tracks item such as:
– investment breakdown by asset category
– stock and fund investment by market capitalization and investment type
– retirement fund amounts and year over year value
– projected real return
– safe withdrawal rates, both current and projected
– income generation, including dividends, interest, investment yields
– mortgage principal balance
It’s been extremely helpful for financial planning and making necessary adjustments in asset allocation.
The spreadsheet is updated at the end of every calendar quarter with current investments and prices. The most time consuming part of updating it is entering the latest prices for stocks and various funds. So I wrote a simple Python program that takes a list of ticker symbols and generates the current prices for each.
The Program
The program utilizes the api available at Alpha Advantage. You can obtain an api key at no cost, subject to throttling limitations.
A simple GET call of the form:
https://www.alphavantage.co/query?function=GLOBAL_QUOTE&symbol=MSFT&apikey=ABCDEFGHIJKLMNOP
Returns a json payload that looks like this:
{
    "Global Quote": {
        "01. symbol": "MSFT",
        "02. open": "279.1500",
        "03. high": "283.6500",
        "04. low": "278.6800",
        "05. price": "282.9100",
        "06. volume": "16774606",
        "07. latest trading day": "2022-08-05",
        "08. previous close": "283.6500",
        "09. change": "-0.7400",
        "10. change percent": "-0.2609%"
    }
}
The program takes as input a text file containing ticker symbols, and generates a csv output file like this:
Ticker,Price
IWV,220.1600
MSFT,259.5800
VTSAX,91.7700
The program should be self-explanatory. Instructions and code can be found at Github.
Spreadsheet Design
I chose to import the results into Excel to keep the spreadsheet portable, so there would be no external dependencies.
A separate worksheet (i.e. tab) is created to hold the imported price information. Mine is called “Tickers”.
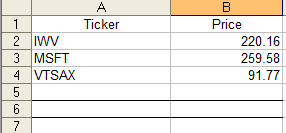
It matches the format of the csv output file.
Define a range on these cells. This will be used for lookups on the Price. e.g. =Tickers!$A$1:$B$6. Mine is called RangeTickers.
In a separate tab, I maintain the list of investments with their associated attributes- name, asset type, dividend rate, etc.
A lookup is done on each to obtain the Price from the Tickers tab.
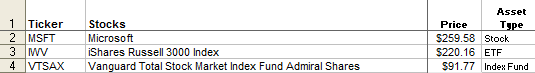
For example, the lookup for the Price column for MSFT:
=OFFSET(Tickers!$A$1,MATCH($A2,RangeTickers,0),1)
Importing the results into Excel
Place the output csv file in the same folder as the spreadsheet.
Now to import the file. In the Tickers tab, select the data range. In my version of Excel, choose Data, Import External Data, Import Data.
Choose the output csv file. Walk through the dialogs to map the data. The defaults should be fine, with the exception of needing to explicitly indicate csv format. Click Finish and the data is imported.
You can set various properties, e.g. to query whether to update the results when you open the spreadsheet and tell it to insert additional rows if your list grows. Select the data range, choose Data, Import External Data, Data Range Properties.
Now that it is set up, for future updates, select the data range, choose Data, Import External Data, Edit Text Import, and select the updated csv file.
Results
Even with a modest list of a couple of dozen holdings, this saves a bunch of time and eliminates errors associated with manual entry.